TABLE OF CONTENTS

1. Introduction
Management and diagnostic questions have different structures and various formats of evidence tables. The formats differ in terms of the data organisation as well as what types of data they present.
You may choose a different format depending on the purpose of your project, the data you want to present, or the organisation you are cooperating with, e.g. Cochrane Collaboration prefers to use the Summary of Findings format.
Below you can find examples of the table formats and learn how to switch between them.
2. Management questions
This is the most common type of PICO question in GRADEpro. The structure is:
Should [intervention] vs. [comparison] be used in/for [health problem or population]
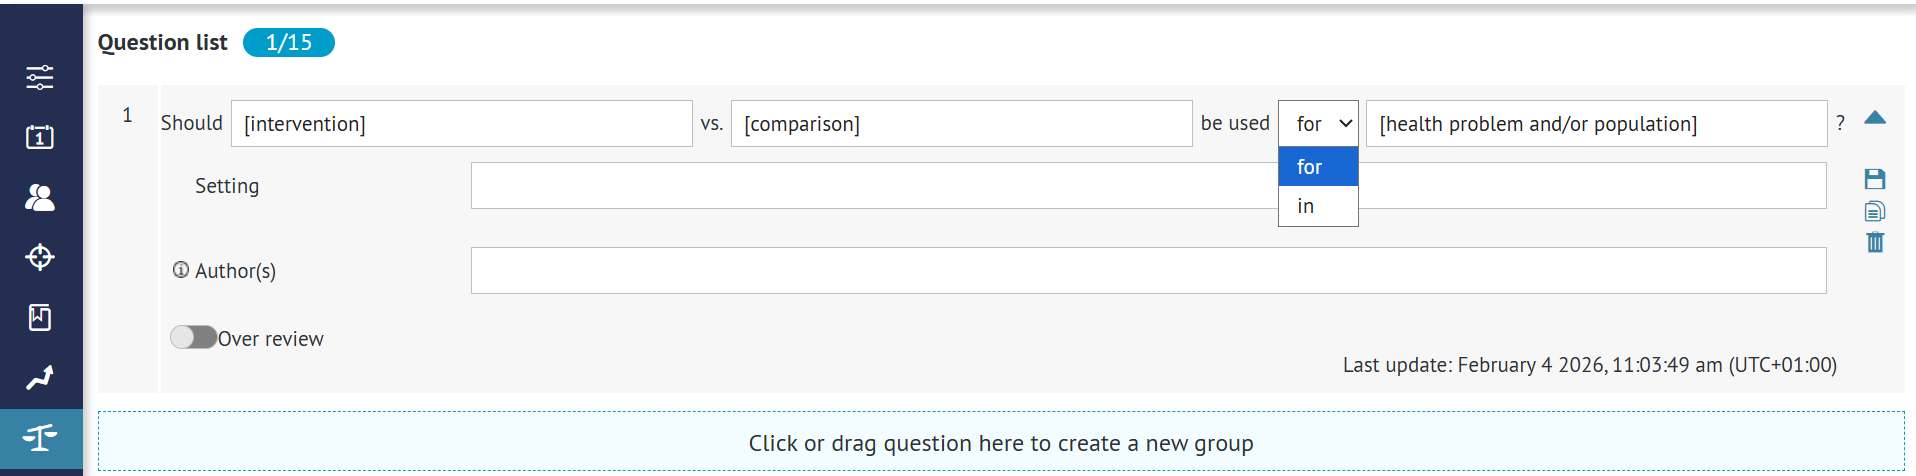
- Intervention: the therapeutic, diagnostic, or other intervention under investigation (e.g. the experimental intervention, or in observational studies, the exposure factor)
- Comparison: the alternative intervention; intervention in the control group
- Health problem or population: the patients or population to whom the recommendations are meant to apply
Example Questions:
1. Should manual toothbrushes vs. powered toothbrushes be used for dental health?
2. Should topical nasal steroids be used in children with persistent allergic rhinitis?
3. Should oseltamivir versus no antiviral treatment be used to treat influenza?
4. Should troponin I followed by appropriate management strategies or troponin T followed by appropriate management strategies be used to manage acute myocardial infarction?
Below, you can see the available evidence table formats for the management questions. You can also learn how to create and complete management questions in our step-by-step manual.
2.1 Management table displays
There are six displays of management tables available:
- 2.1.1 GRADE evidence profile
- 2.1.2 Summary of Findings table
- 2.1.3 GRADE profile (v2)
- 2.1.4 Summary of Findings table (v2)
- 2.1.5 Summary of Findings table (v3)
- 2.1.6 Summary of Findings table (v4)
- 2.1.7 Interactive SoF
The examples and detailed descriptions are available below. Each example presents exactly the same set of mock data to showcase differences in data presentation between the tables.
Additionally, all of the management tables (with the exception of Interactive SoF) can be presented in narrative mode if all outcomes within the table are narrative outcomes. Examples of narrative tables are also presented below. When in narrative mode, some elements of the header of the table related to the numerical data, e.g. the relative effect column, are removed since no such data are presented for narrative outcomes.
Tip: You can choose between table displays by clicking on the icon on the right hand side of the table header.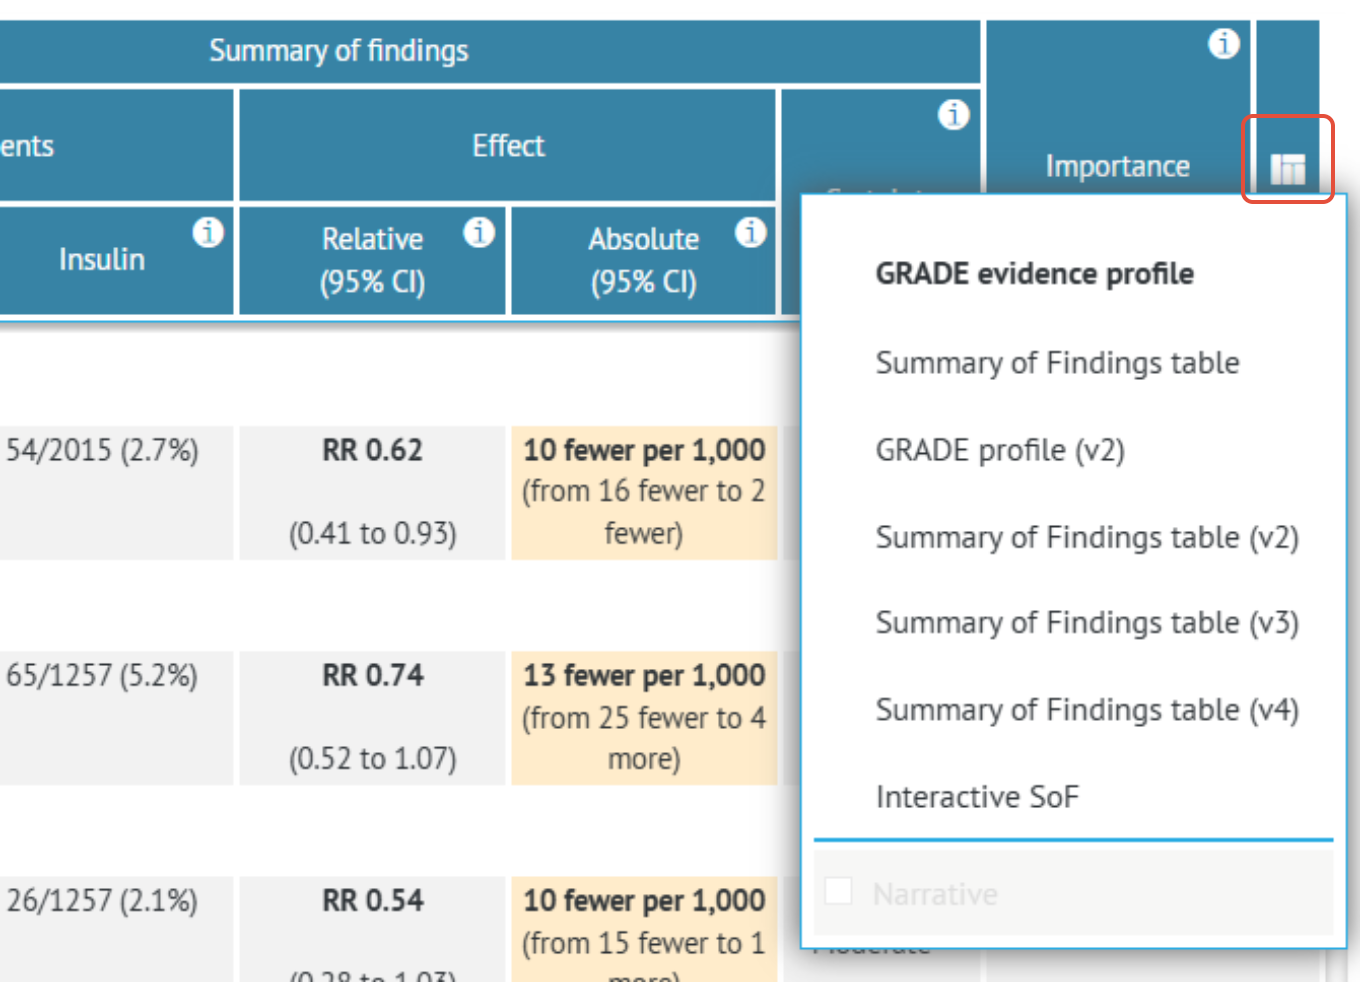
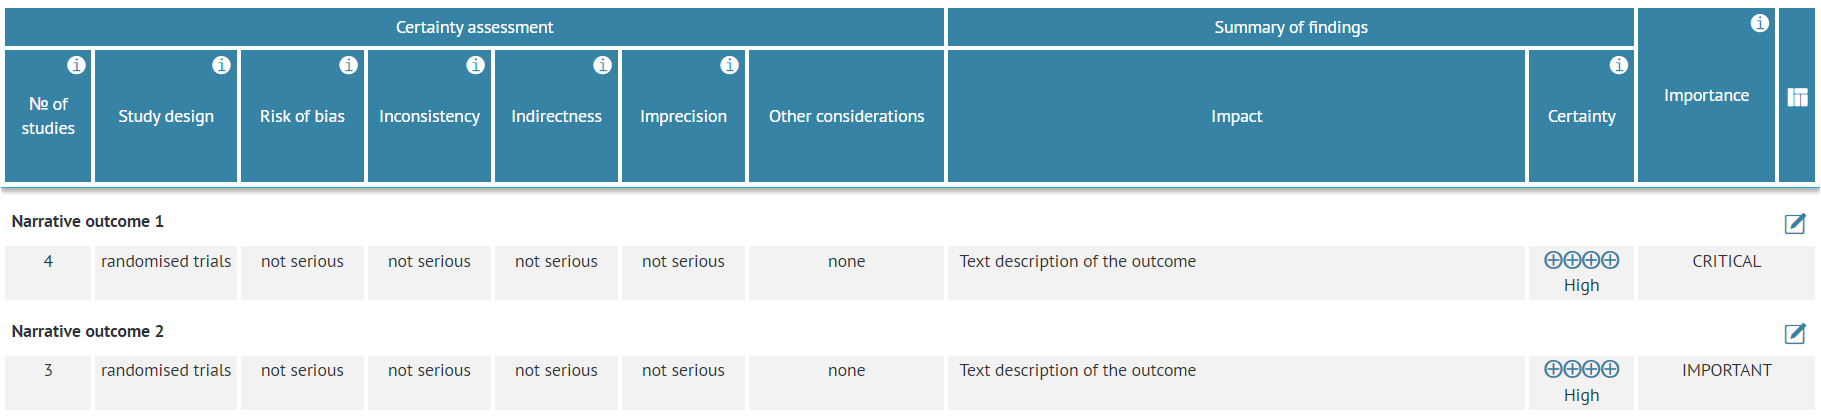
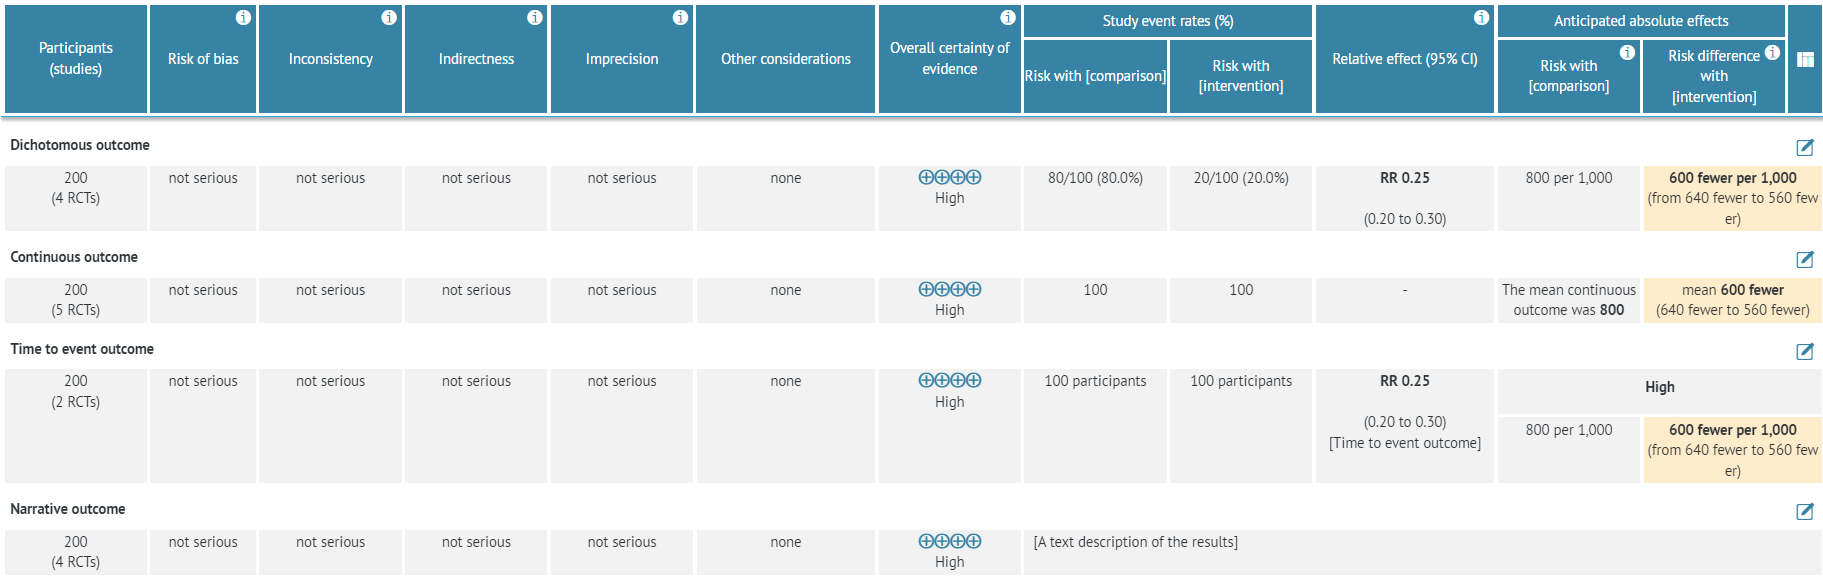
2.1.1 GRADE evidence profile
GRADE evidence profile is the standard format of the evidence table supported by the GRADE Working Group. It is also the default format of evidence tables in GRADEpro - whenever you create a new project, the tables will be set as GRADE evidence profiles.
GRADE evidence profile presents all the elements of the GRADE certainty assessment as separate columns, which is useful when assessing the evidence quality or if it is important to display the quality assessment in a clear and prominent manner.
A GRADE evidence profile is particularly useful for the presentation of evidence supporting a recommendation in clinical practice guidelines, but also as a summary of evidence for other purposes where users need or want to understand the judgments about the quality of evidence in more detail.
GRADE evidence profile with mock data:

GRADE evidence profile in narrative mode:
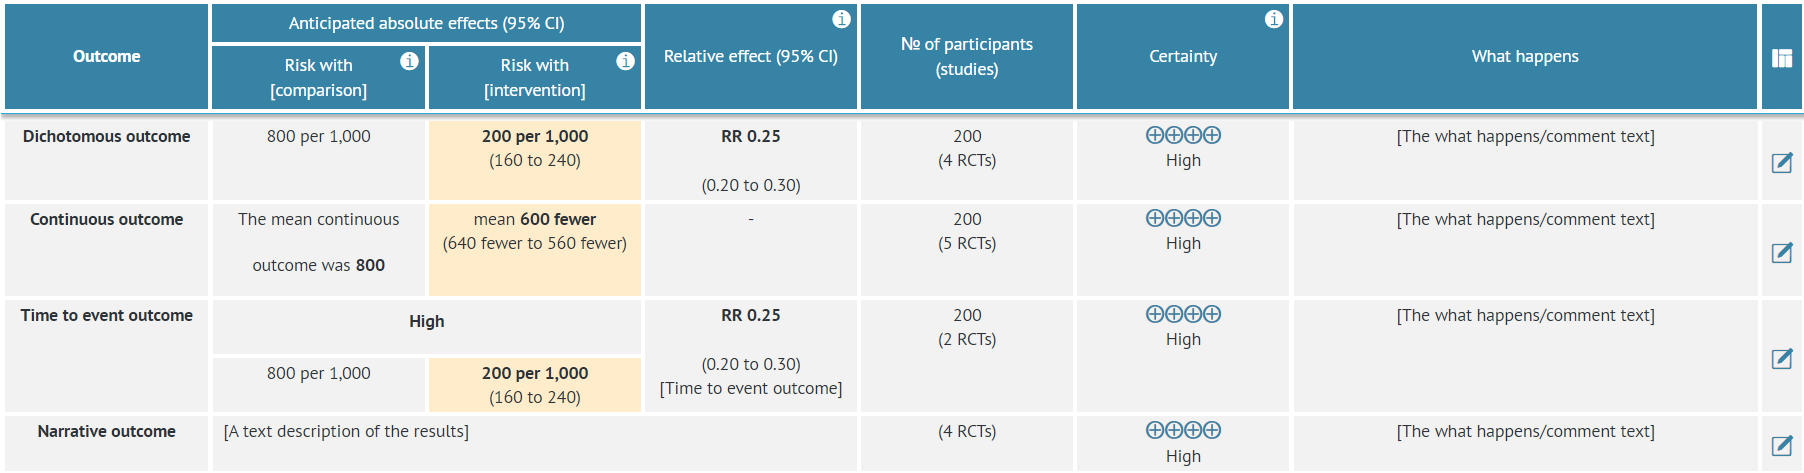
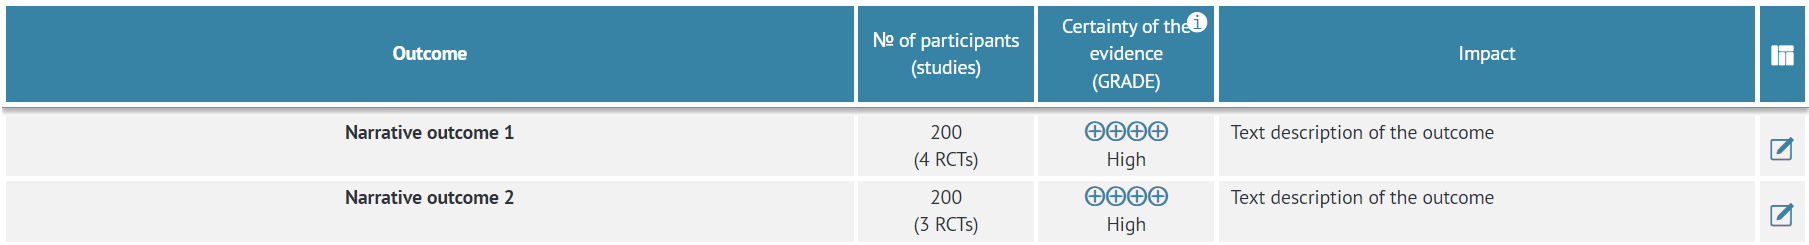
2.1.2 Summary of Findings table
The Summary of Findings table is another widely used format of the evidence table, especially popular within the Cochrane Collaboration.
Summary of Findings tables provide a summary of findings for each of the included outcomes and the quality of evidence rating for each outcome in a quick and accessible format, without details of the judgements about the quality of evidence. They are intended for a broader audience, including end users of systematic reviews and guidelines. They provide a concise summary of the key information that is needed by someone making a decision and, in the context of a guideline, provide a summary of the key information underlying a recommendation.
Summary of Findings table with mock data:
Summary of Findings table in narrative mode:
2.1.3 GRADE profile (v2)
GRADE profile (v2) is a modification of the GRADE evidence profile.
The order of columns is changed compared to the GRADE evidence profile. The labelling of some of the columns has been changed as well, e.g. overall certainty of evidence instead of certainty.
GRADE profile (v2) with mock data:
GRADE profile (v2) in narrative mode:
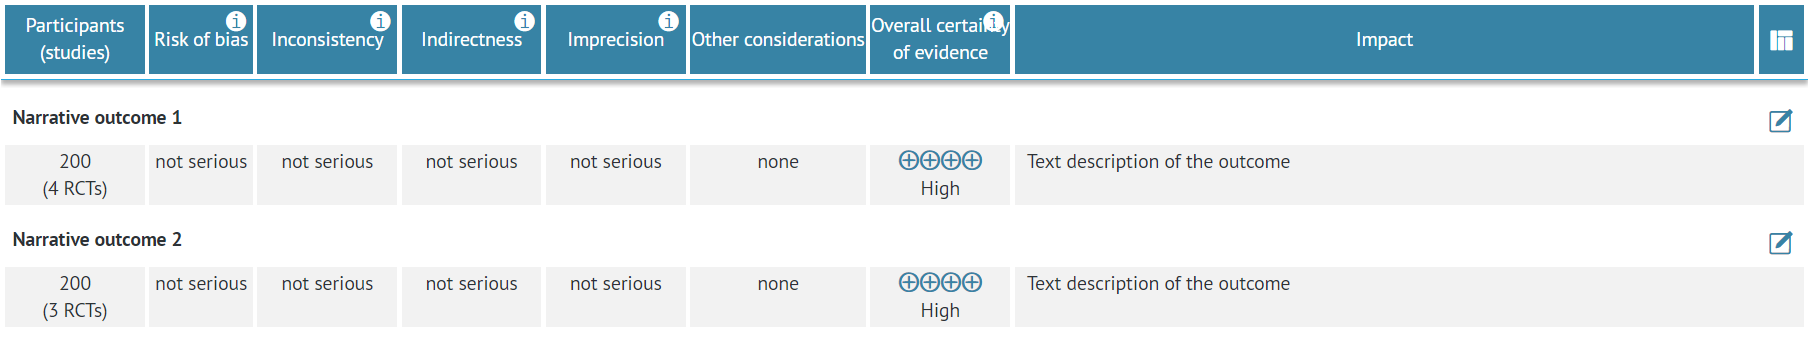
2.1.4 Summary of Findings table (v2)
The Summary of Findings table (v2) is a modified version of the Summary of Findings table.
The order of columns has been changed, and the What happens/Comments column has been removed.
Summary of Findings table (v2) with mock data:
 Summary of Findings table (v2) in narrative mode:
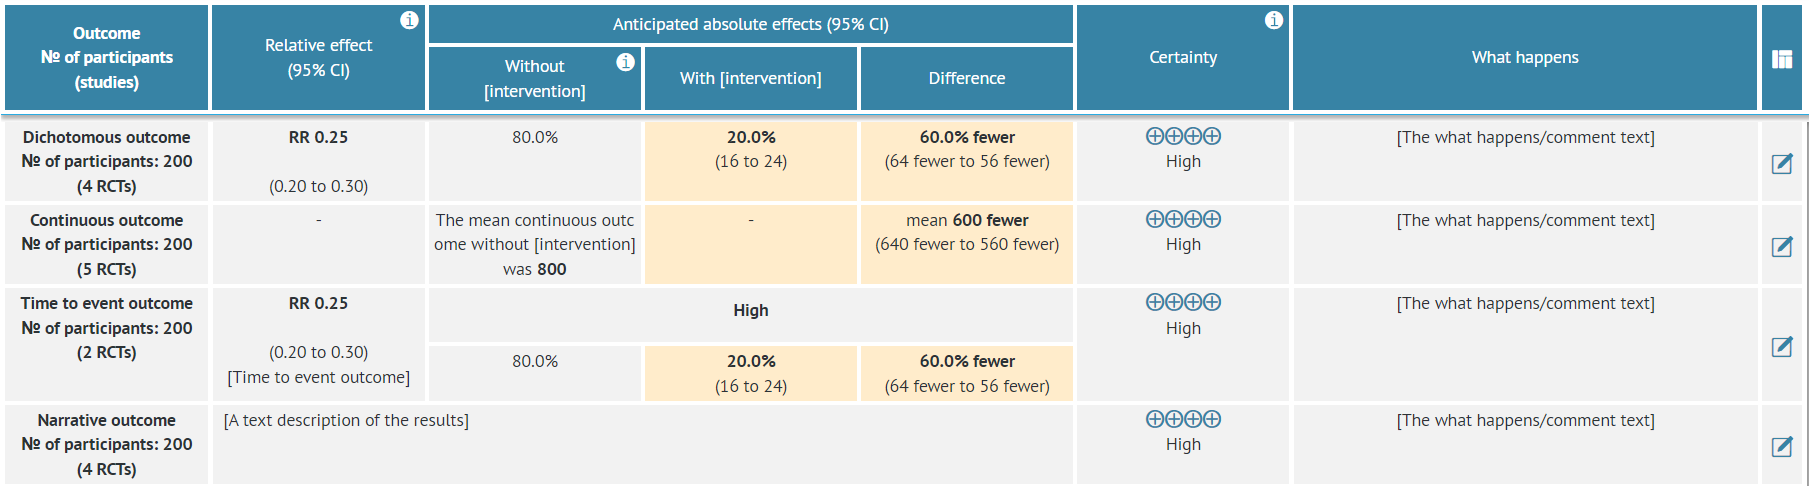
2.1.5 Summary of Findings table (v3)
Summary of Findings table (v3) is a modified version of the Summary of Findings table.
There is an additional column, Difference, which presents the absolute difference of effect between the intervention and comparison groups.
Summary of Findings table (v3) with mock data:
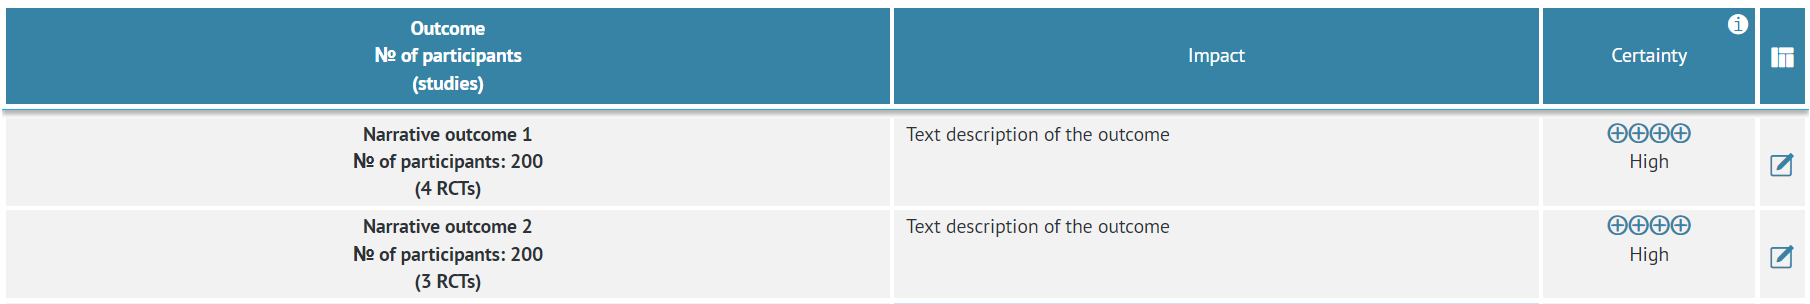
Summary of Findings table (v3) in narrative mode:
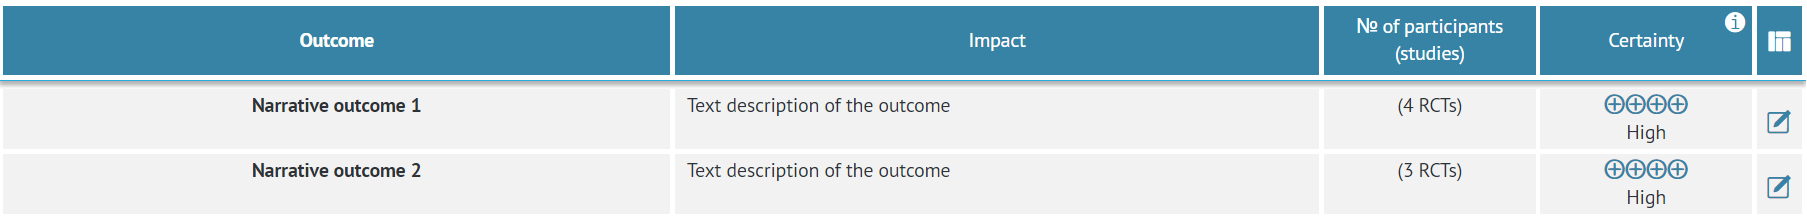
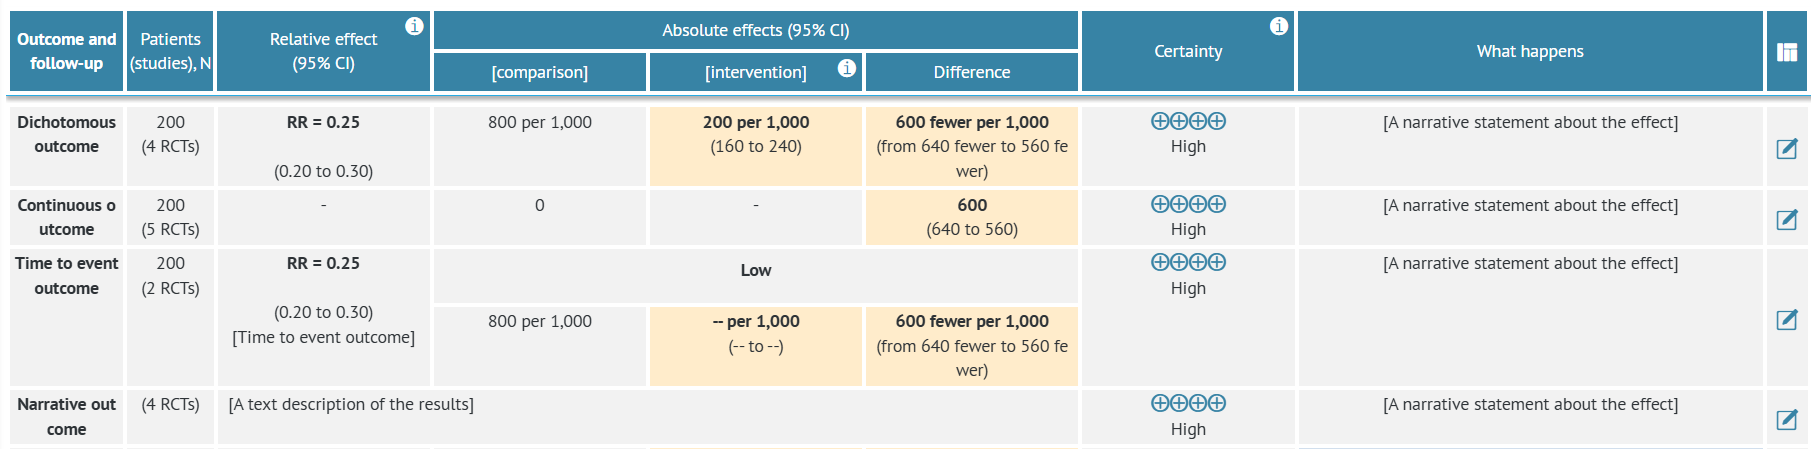
2.1.6 Summary of Findings table (v4)
Summary of Findings table (v4) is a modified version of the Summary of Findings table.
It is similar SoF v3, but the outcome and number of patients and studies columns were split, the numeric data are presented in absolute values instead of percentage. Labels of interventions groups were simplified.
Summary of Findings table (v4) with mock data:
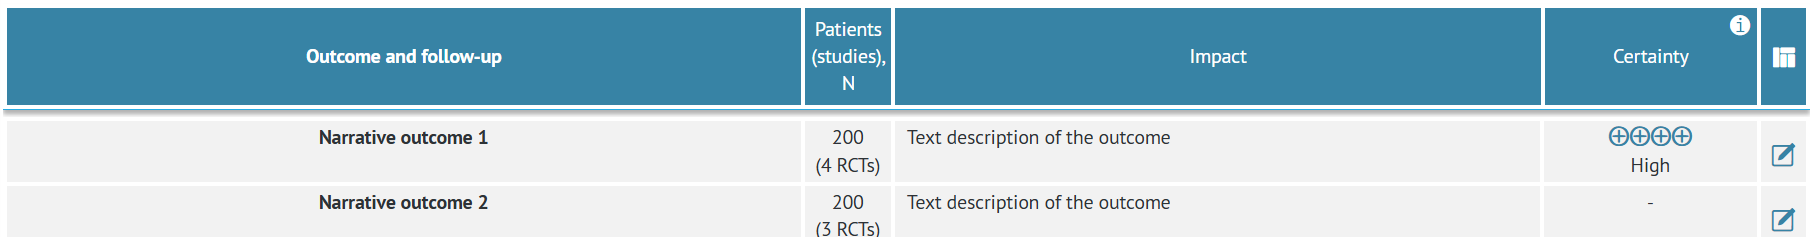
Summary of Findings table (v4) in narrative mode:
2.1.7 Interactive SoF
The Interactive Summary of Findings (iSoF) table is a format created by the Epistemonikos Foundation. It has been designed as a way of presenting the body of evidence in a visually appealing and interactive way. The table presents outcomes as numbers, additionally offering infographics that can help visualize the results.
iSoF also has an additional column for plain language summaries - descriptions of the results delivered in plain language for better understanding.
While in the iSoF view, the table cannot be edited except for the plain language summaries. To edit the rest of the data, you need to switch to a different view of the table.
iSoF table with mock data:
 Here you can access the fully interactive version of the above table.
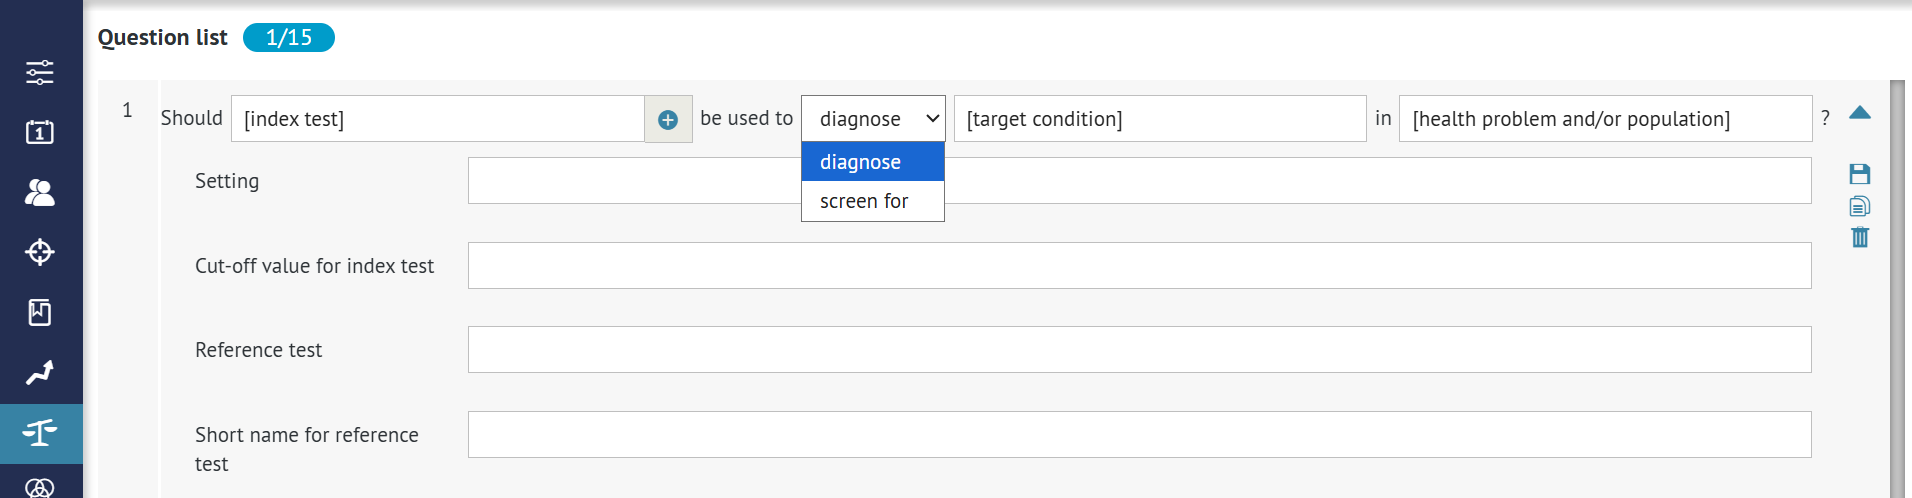
3. Diagnostic questions
The structure is:
Should [index test] be used to diagnose/screen for [target condition] in [health problem and/or population]?
or
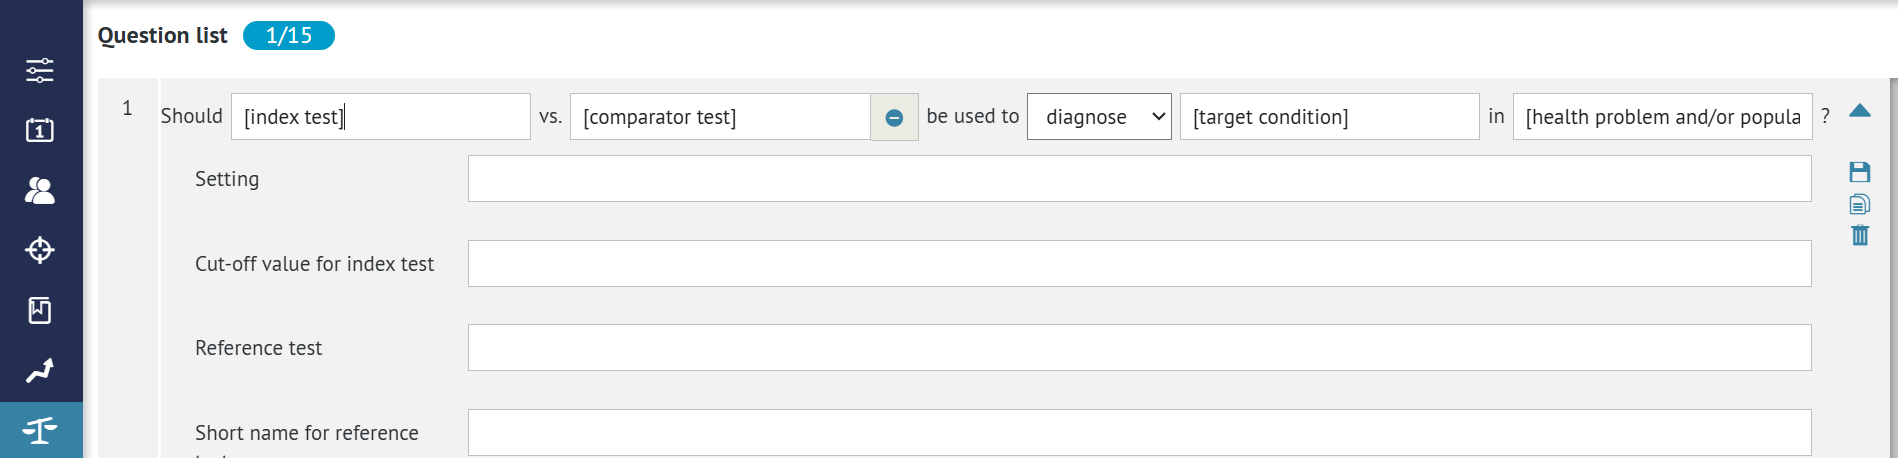
Should [index test] vs. [comparator test] be used to diagnose [target condition] in [health problem and/or population]?
or
- index test: the test that is the object of your research
- comparator test: is optional and is an alternative method of diagnosis
- target condition: the condition diagnosed by the index test
- health problem or population: the patients or populations to whom the recommendations are meant to apply
As opposed to management questions, the diagnostic question can be facilitated to decide on the best way of detecting a health state and not curing it.
Below you can see available evidence table formats for the diagnostic questions. You can also learn how to create and complete diagnostic questions in our step-by-step manual.
3.1 Diagnostic table displays
There are five displays of diagnostic tables available:
- 3.1.1 Layer one
- 3.1.2 Layer two
- 3.1.3 Layer one - SoF
- 3.1.4 Layer two - SoF
- 3.1.5 Diagnostic Interactive SoF
The examples and detailed descriptions are available below. Each example presents exactly the same set of mock data to showcase differences in data presentation between the tables.
For diagnostic tables, there is no narrative mode available. However, a diagnostic table in GRADEpro can present one test or compare two tests to each other. Both cases will be shown for each table format.
Tip: You can choose between table displays by clicking on the icon on the right hand side of the table header.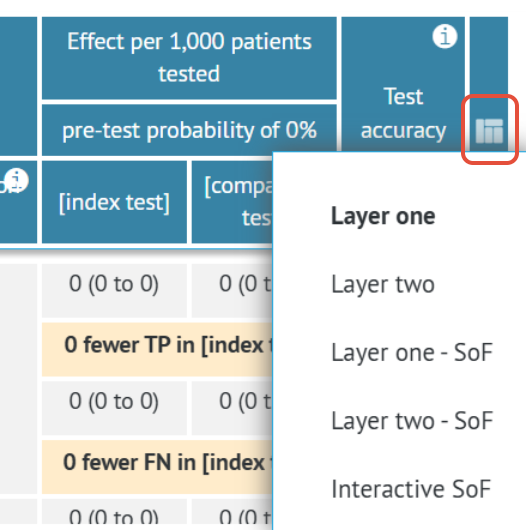
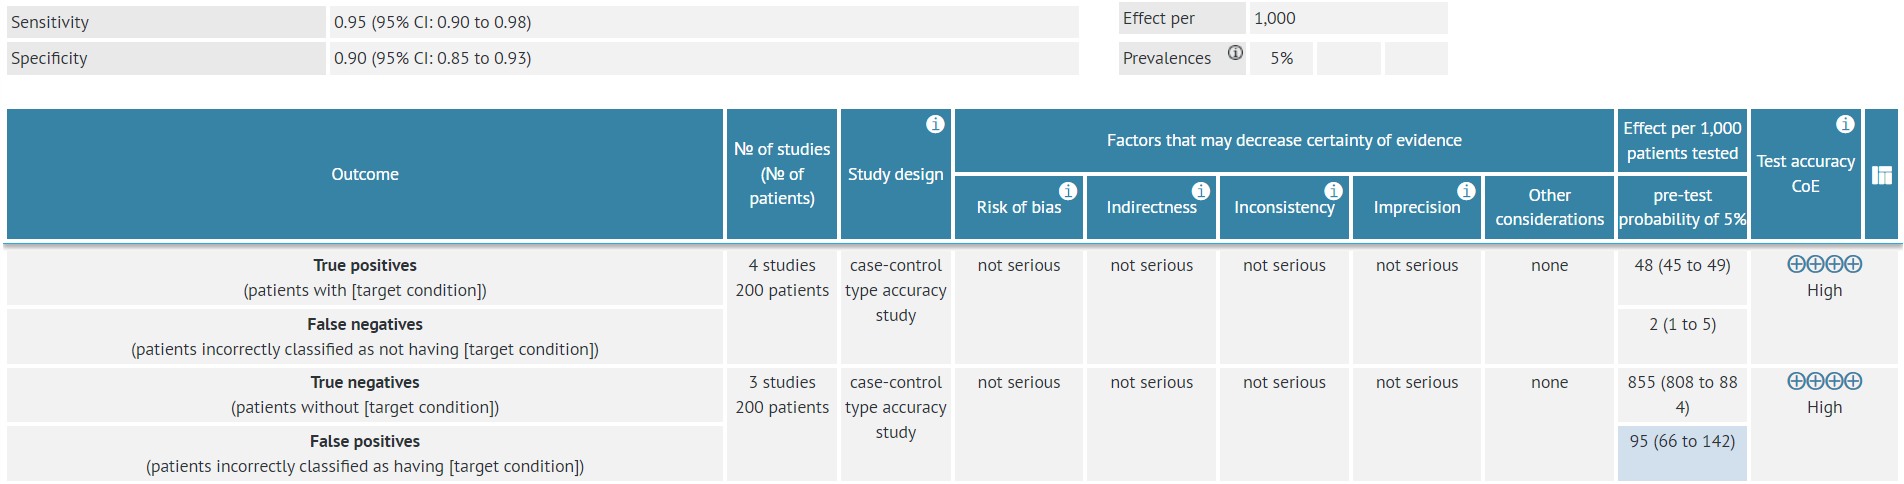
3.1.1 Layer one
Layer one is the diagnostic table equivalent of the GRADE evidence profile.
It is the default format of diagnostic evidence tables in GRADEpro - whenever you create a new project, the diagnostic tables will be set as Layer one.
Layer one presents all the elements of GRADE certainty assessment as separate columns, which is useful when assessing the evidence quality or if it is important to display the quality assessment in a clear and prominent manner.
Layer one diagnostic table with mock data for one diagnostic test:
Layer one diagnostic table with mock data comparing two diagnostic tests: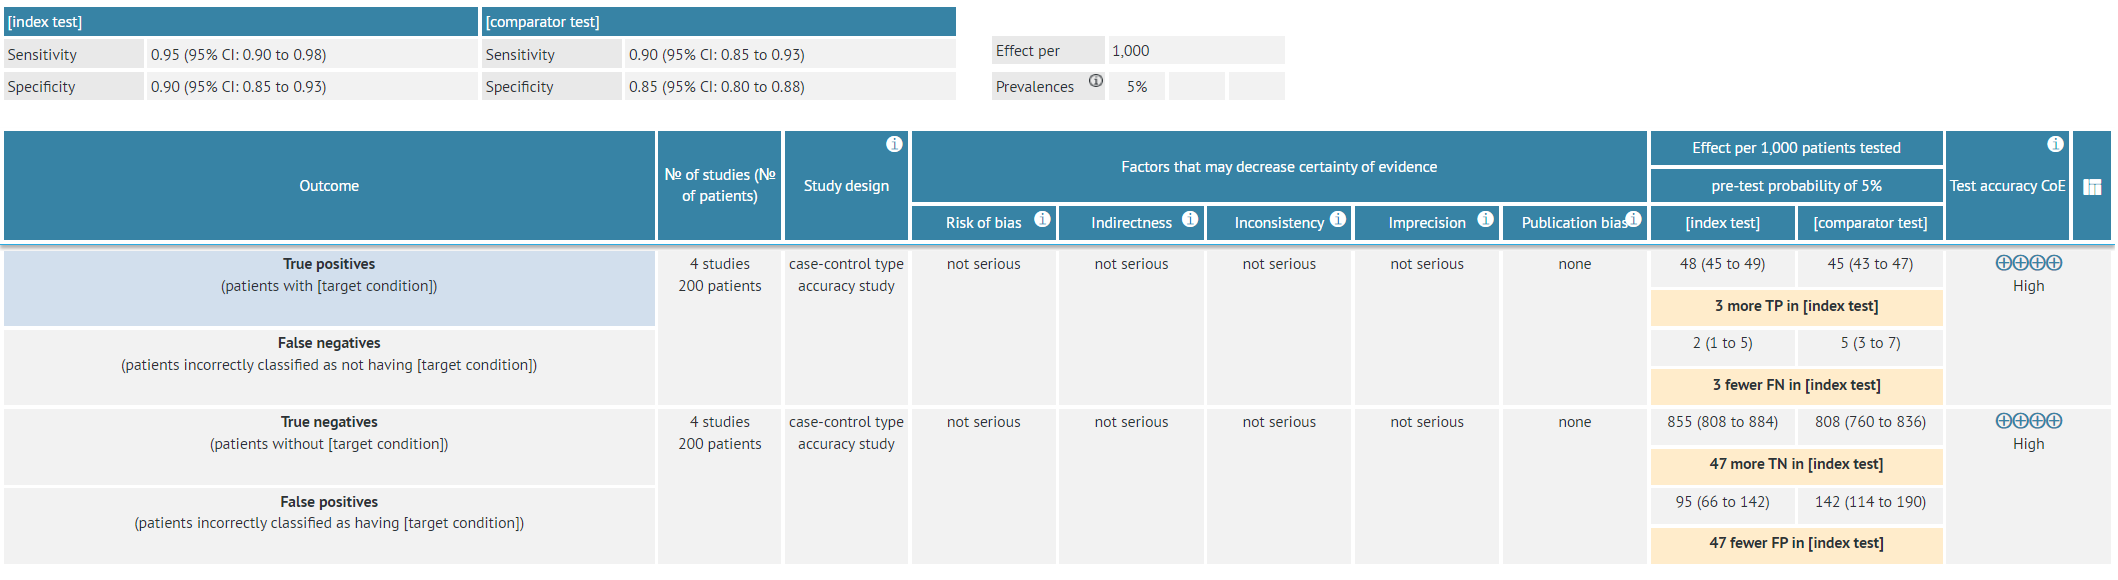
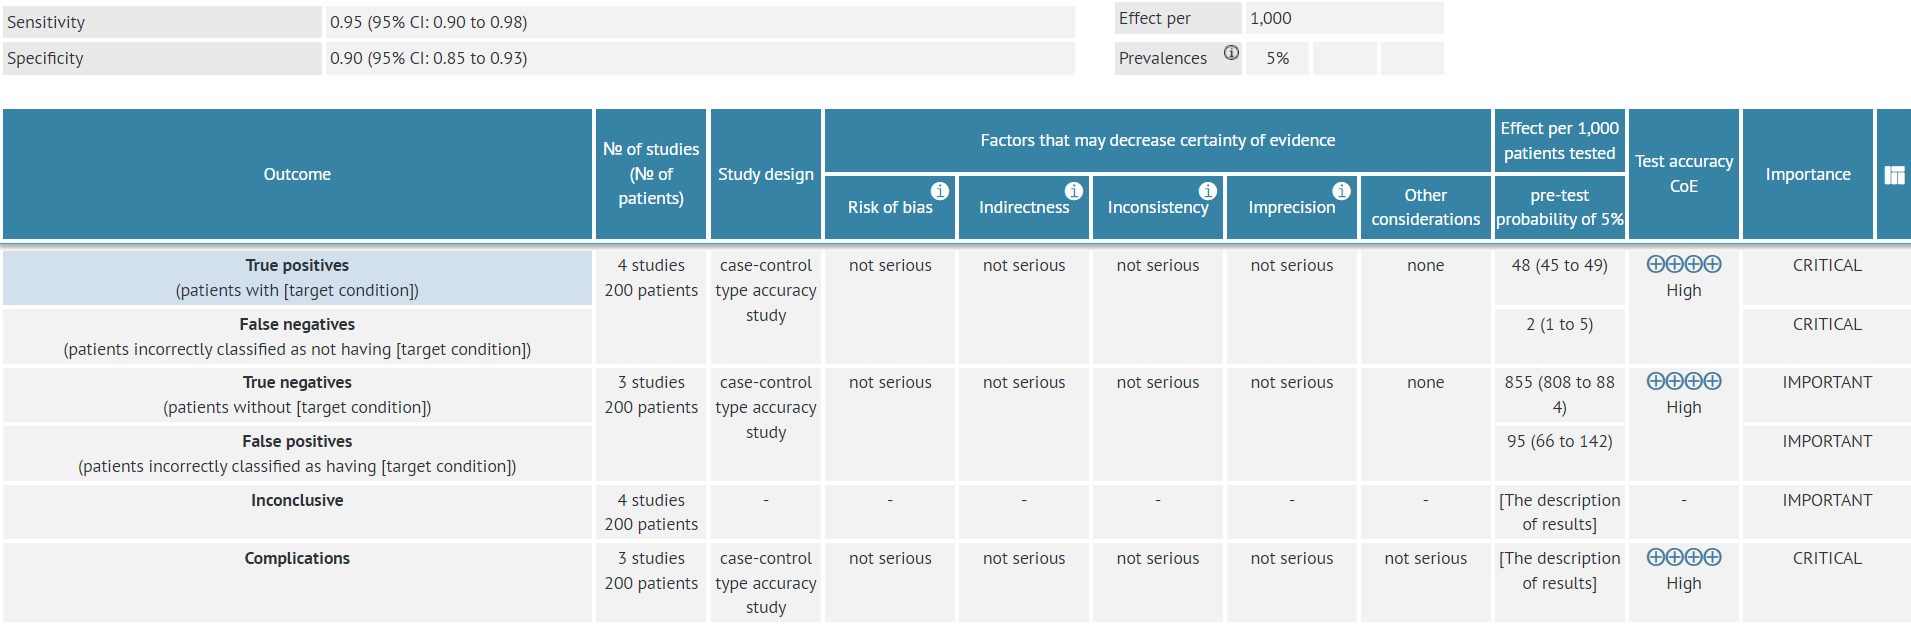
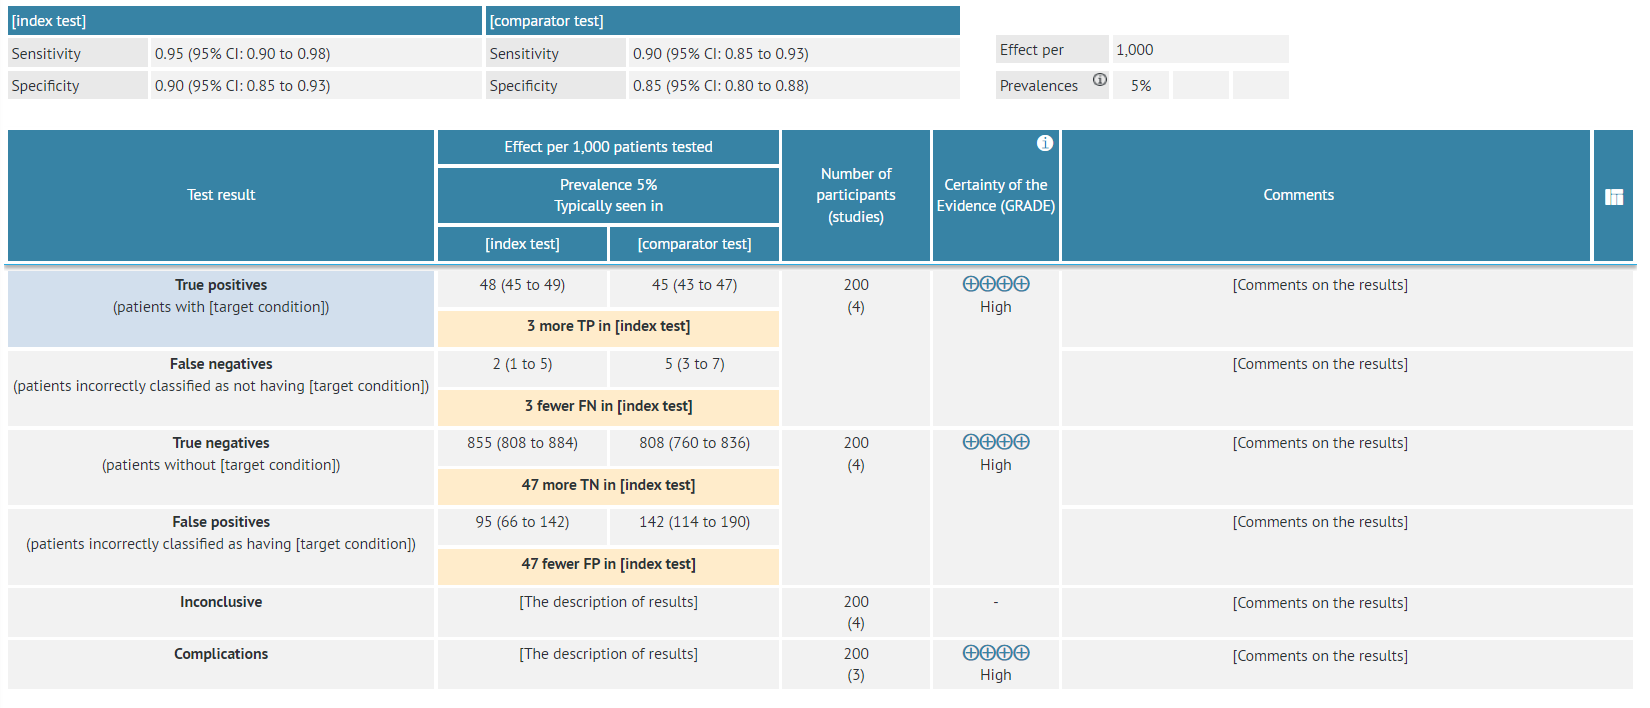
3.1.2 Layer two
Layer two is a variation of layer one. It shows the same details and, additionally, the rows of data for the inconclusive test results and test-related complications. The inconclusive results are not subject to quality assessment. Layer two allows for rating the results' importance as well.
Layer two diagnostic table with mock data for one diagnostic test:
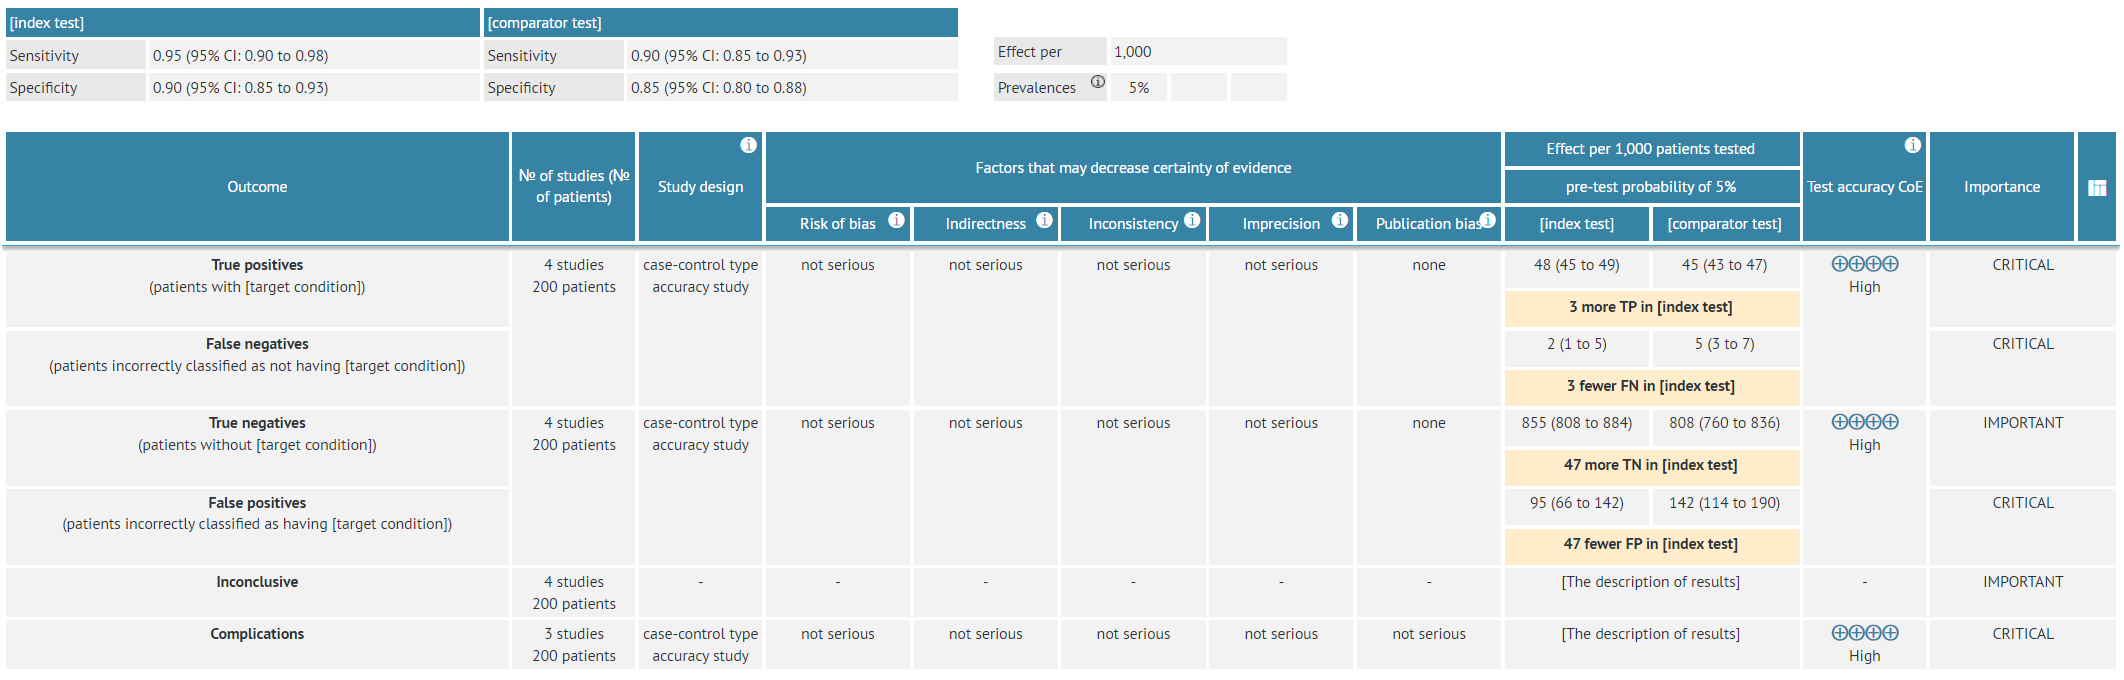
Layer two diagnostic table with mock data comparing two diagnostic tests:
3.1.3 Layer one - SoF
Layer one-SoF is the diagnostic table equivalent of the Summary of Findings table.
It provides a summary of findings as well as the quality of evidence rating for each type of result in a quick and accessible format, without details of the judgements about the quality of evidence. They are intended for a broader audience, including end users of systematic reviews and guidelines. They provide a concise summary of the key information that is needed by someone making a decision and, in the context of a guideline, provide a summary of the key information underlying a recommendation.
Layer one-SoF diagnostic table with mock data for one diagnostic test:
 Layer one-SoF diagnostic table with mock data comparing two diagnostic tests:
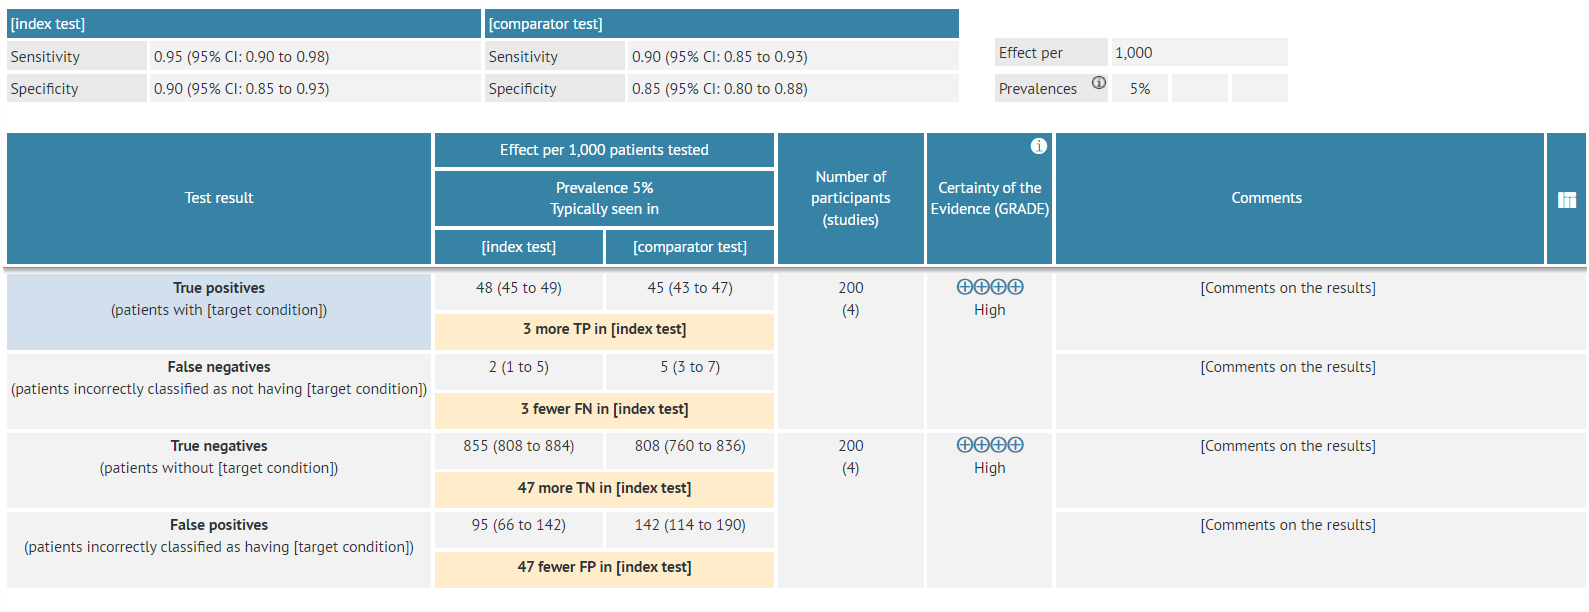
3.1.4 Layer two - SoF
Layer two-SoF is a variation of layer one-SoF. It shows the same details and, additionally, the rows of data for the inconclusive test results and test-related complications. The inconclusive results are not subject to quality assessment.
Layer two-SoF diagnostic table with mock data for one diagnostic test:
 Layer two-SoF diagnostic table with mock data comparing two diagnostic tests:
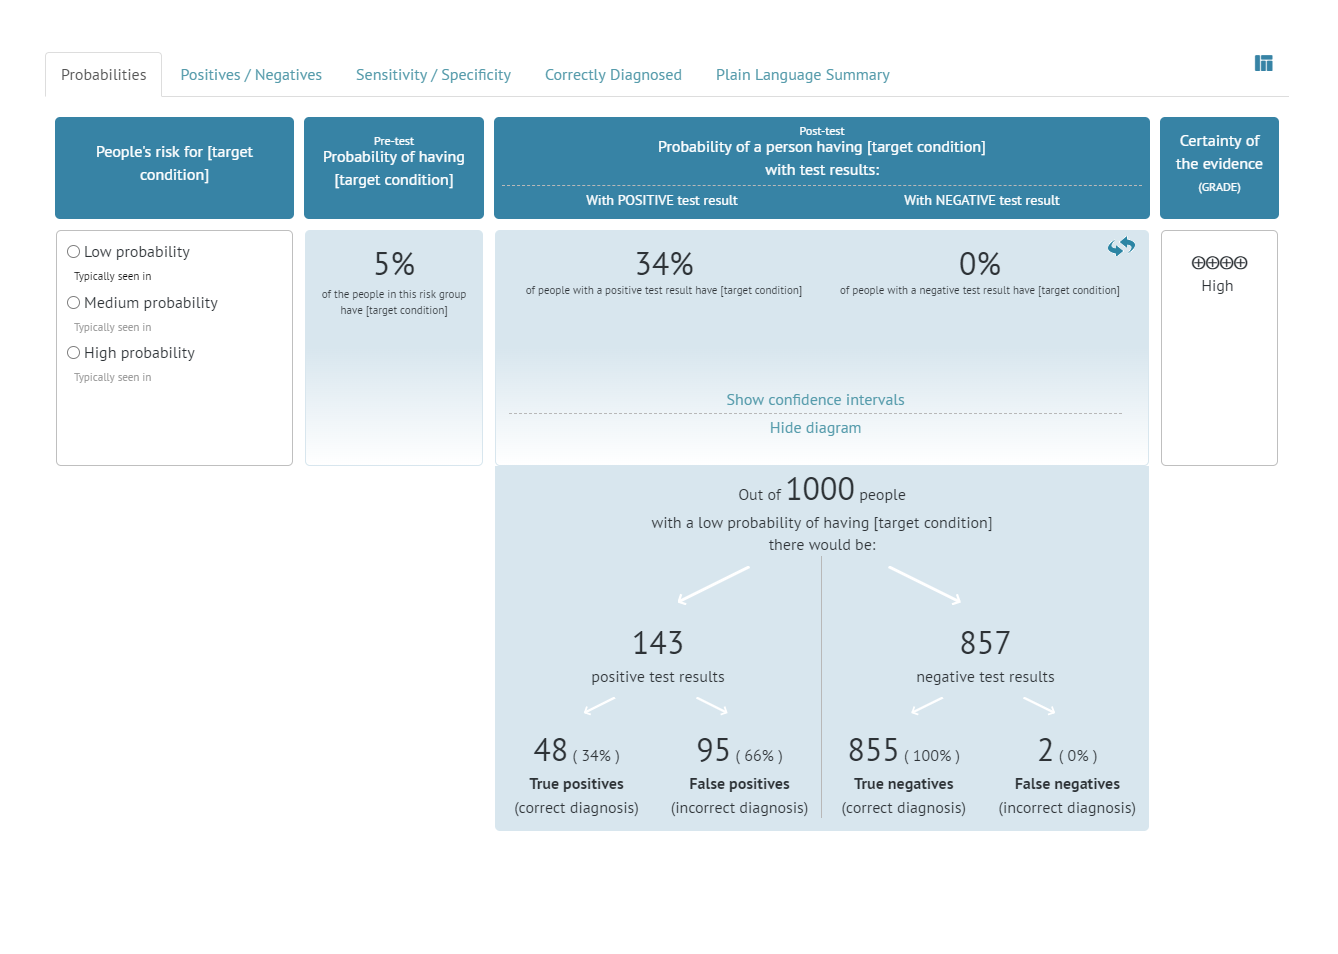
3.1.5 Diagnostic Interactive SoF
The Interactive Summary of Findings (iSoF) table is a format created by Epistemonikos Foundation. It has been designed as a way of presenting the body of evidence in a visually appealing and interactive way. The table presents the results as numbers, additionally offering infographics that can help visualize them.
A diagnostic iSoF has five sections depicting different aspects of the results presented in diagnostic tables:
- Probabilities - Probability of a person having the target condition with positive or negative test results:
- Positives/Negatives - Data on true and false positive and negative results
- Sensitivity/Specificity - Data on the sensitivity and specificity of the test
- Correctly diagnosed - Data on the number of people who would be correctly diagnosed with the test
- Plain language summary - plain language description of the results and the meaning for the patients
While in the iSoF view, the table cannot be edited. To edit the data, you need to switch to a different view of the table.
Diagnostic iSoF table with mock data for one test (first page):
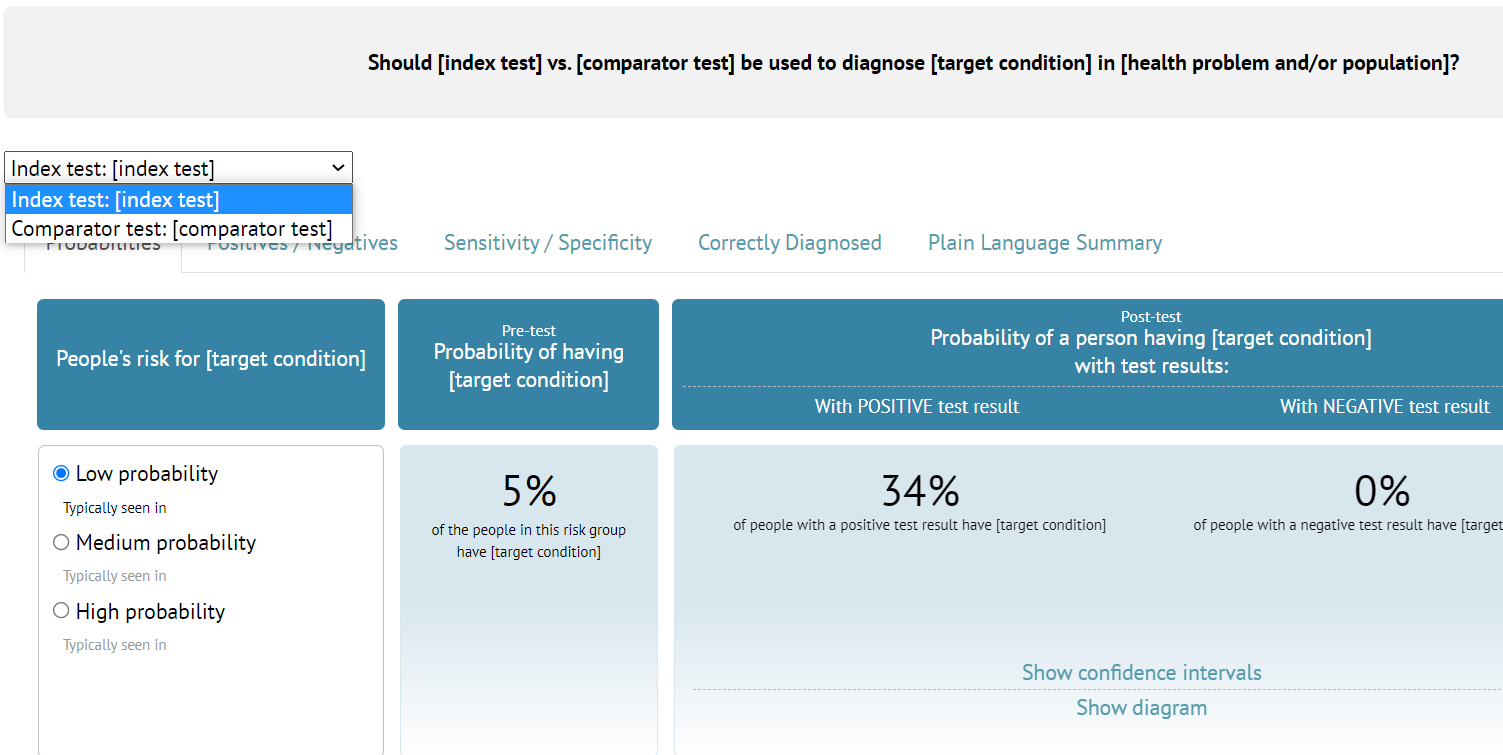
When comparing two diagnostic tests, two iSoF tables are presented, one for each test. The user can switch between them with a dropdown.
4. How to change the table view
For both management and diagnostic evidence tables, the display can be changed in the same way - using the icon on the right-hand side of the table header.
 The data within the table are saved regardless of the format change. If some field is displayed in one type of table but not in other, its content remains intact when the display is changed.
E.g. the What happens/Comments field is available only in the Summary of Findings formats. If it is filled in and the table is changed to a GRADE profile view, this text field disappears. However, upon reverting to an SoF format, the content will be displayed again, intact.
RELATED ARTICLES
Was this article helpful?
That’s Great!
Thank you for your feedback
Sorry! We couldn't be helpful
Thank you for your feedback
Feedback sent
We appreciate your effort and will try to fix the article